
As part of the Health Spending Accountability and Transparency Program, OHIC collaborated with an analytics consultant and the Health Care Cost Trends Steering Committee to develop interactive dashboards that utilize All-Payer Claims Database (APCD) data. These dashboards provide transparent reporting on trends in the cost and use of healthcare services in Rhode Island. The purpose is to inform provider organizations, payers, purchasers, policymakers, and state residents interested in improving the affordability of healthcare in Rhode Island.
The dashboards employ common methods for analyzing healthcare spending. Because alternative methods will produce different results, the measures reported here may differ from those generated by the Rhode Island Medicaid program. Individuals eligible for both Medicaid and Medicare, known as dual eligibles, are included only under their primary insurance coverage.
Although we believe the information, analysis, and methodology presented in the Cost Trends reports are accurate, reporting errors may impact the tool's calculations. Users assume responsibility for determining the tool's suitability for their purposes and use it at their own risk. OHIC may modify the information and analysis without notice.
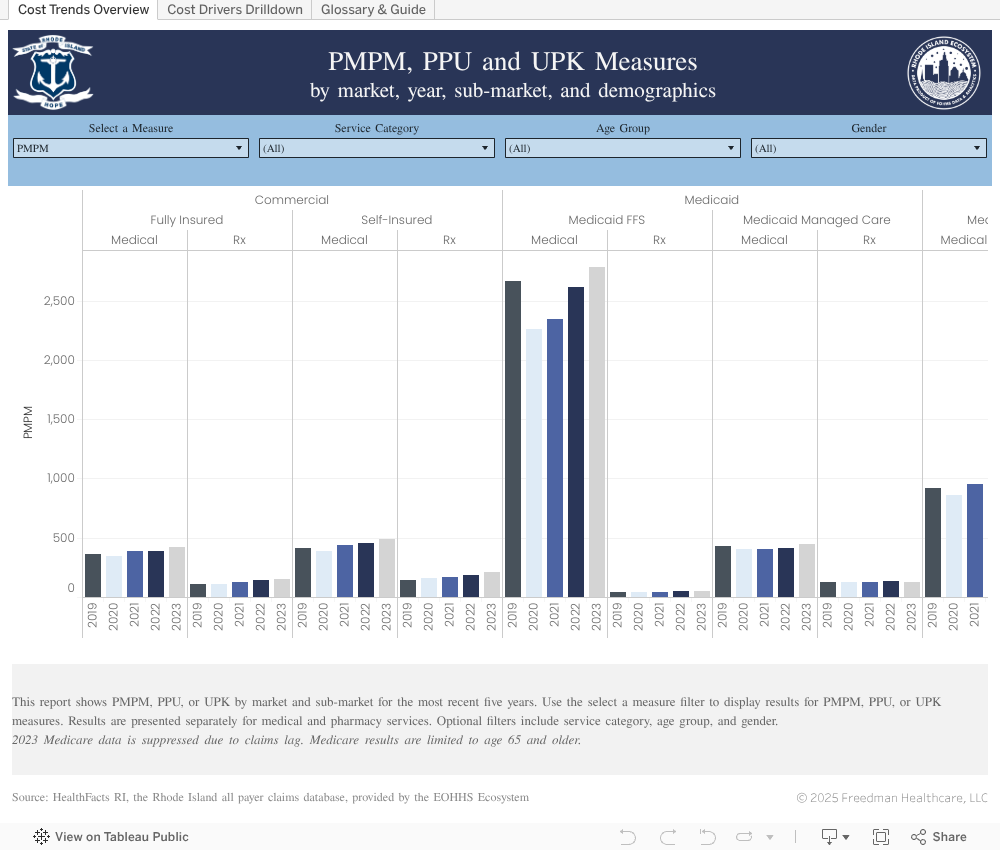
This dashboard summarizes health care utilization and spending measures and the number of covered lives by payer type in Rhode Island. This information supports analysis and understanding of health care cost drivers to generate insights into policy options for slowing spending growth within the state. Pharmacy spending data does not account for manufacturer rebates.
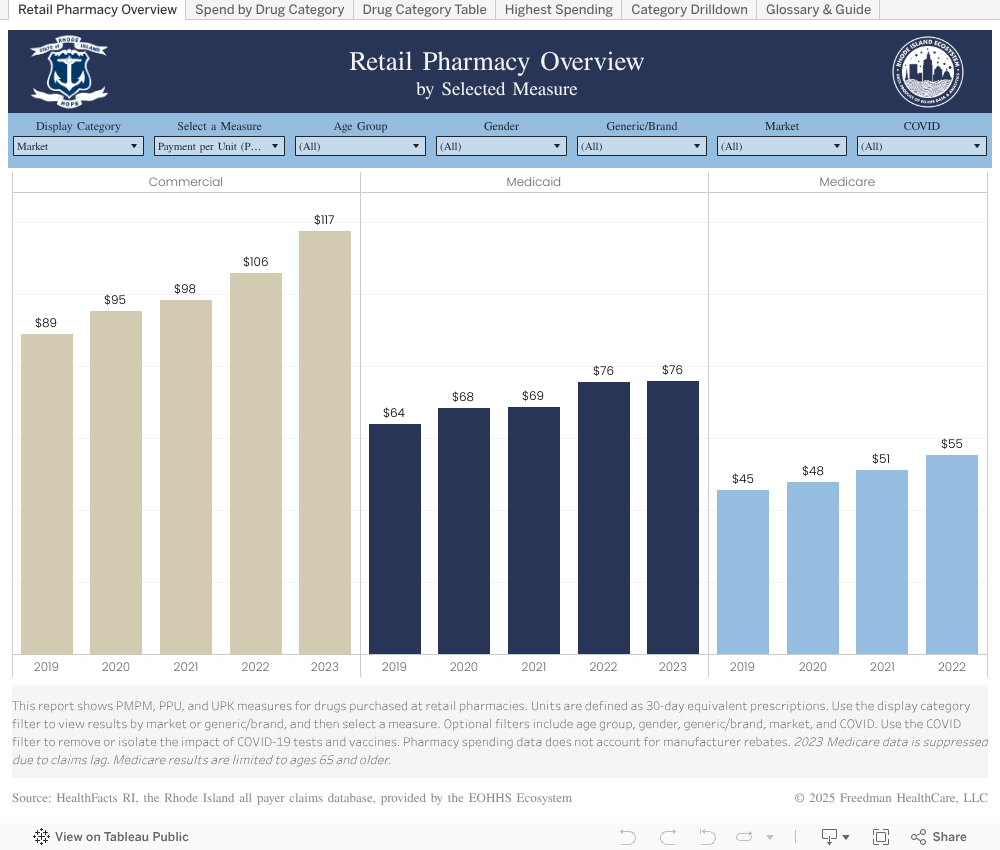
This dashboard compares retail pharmacy spending and utilization measures by drug category and identifies drugs that account for the largest share of total spending. The U.S. Pharmacopeia (USP) created a system to classify drugs into 51 categories based on the condition they are intended to treat. Pharmacy spending data does not account for manufacturer rebates.
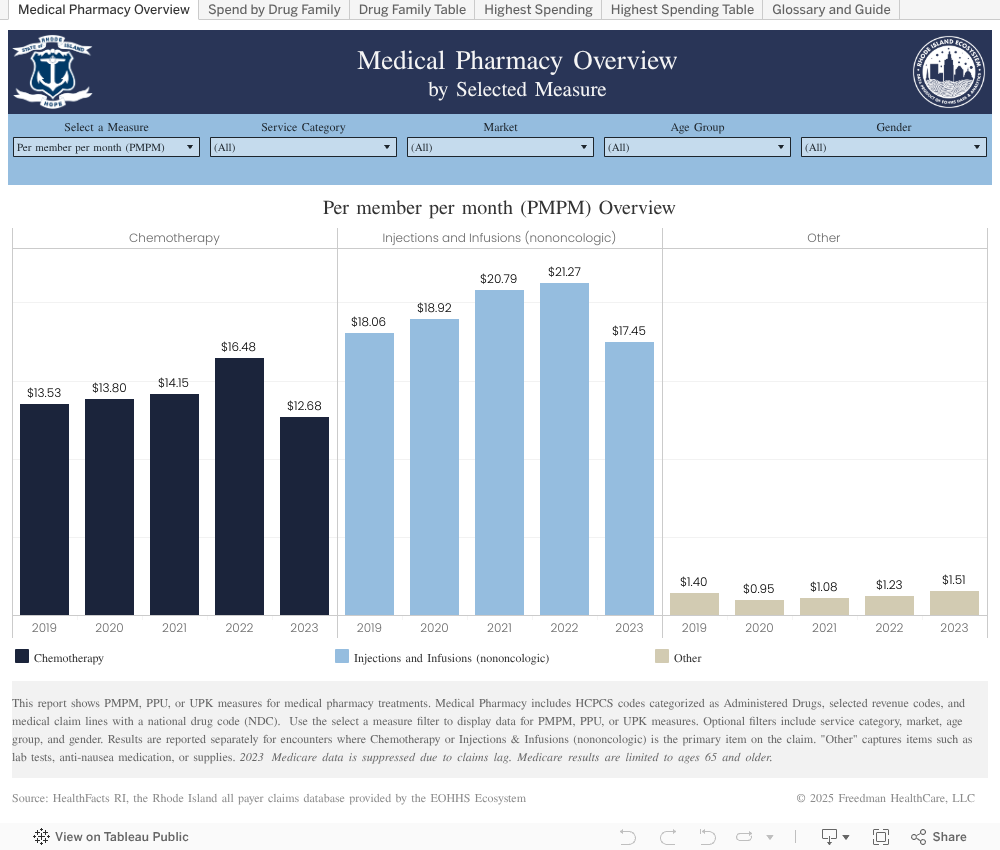
This dashboard supports analysis of medical pharmacy spending, compares cost and utilization measures by drug category, and identifies drugs that account for the largest share of total spend. This dashboard uses the Restructured BETOS Classification System (RBCS) categories to analyze utilization and spending. The logic is based on Healthcare Common Procedure Coding System (HCPCS) procedure codes. Additionally, facility claims often use Revenue and/or National Drug Codes (NDCs) instead of HCPCS, and those are also included here.
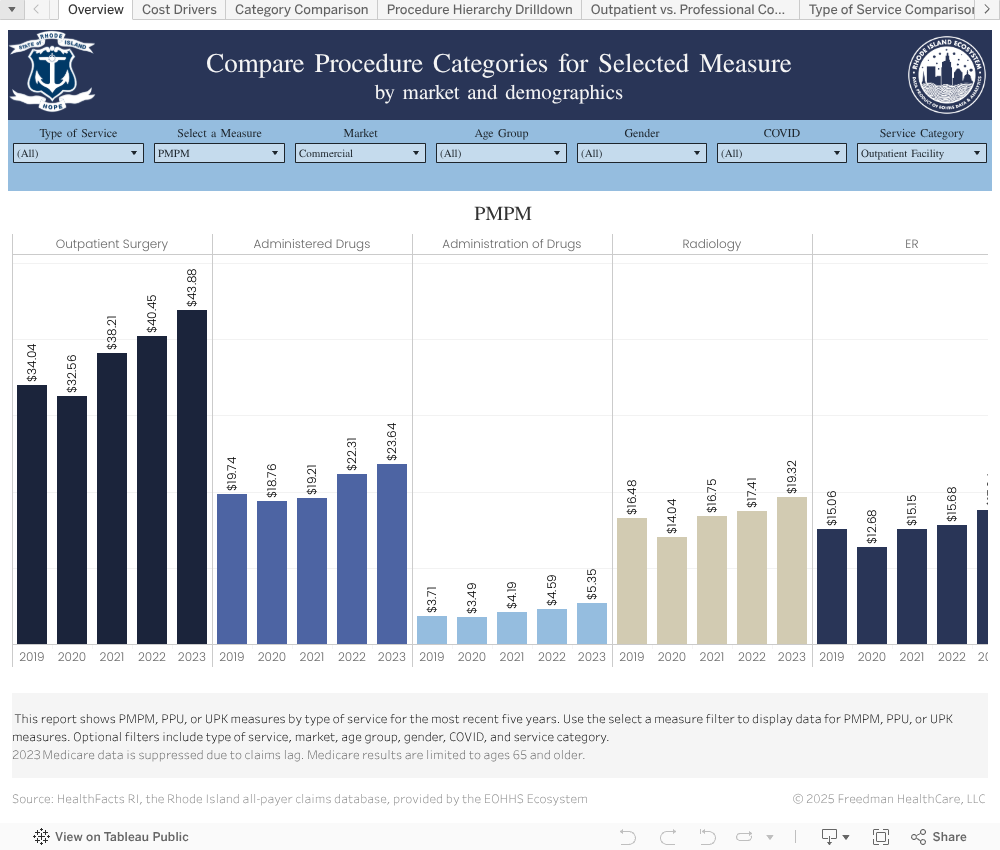
This dashboard utilizes the Restructured BETOS Classification System (RBCS) categories along with derived, user-intuitive Type of Service categories to analyze utilization and spending for medical services typically delivered in Outpatient facility or Professional/Office care settings. Berenson-Eggers Type of Service (BETOS) codes are assigned for each Healthcare Common Procedure Coding System (HCPCS) or Current Procedural Terminology (CPT) procedure code. The BETOS Coding System was developed primarily for analyzing growth in Medicare expenditures and has been updated and expanded by CMS since 2021.
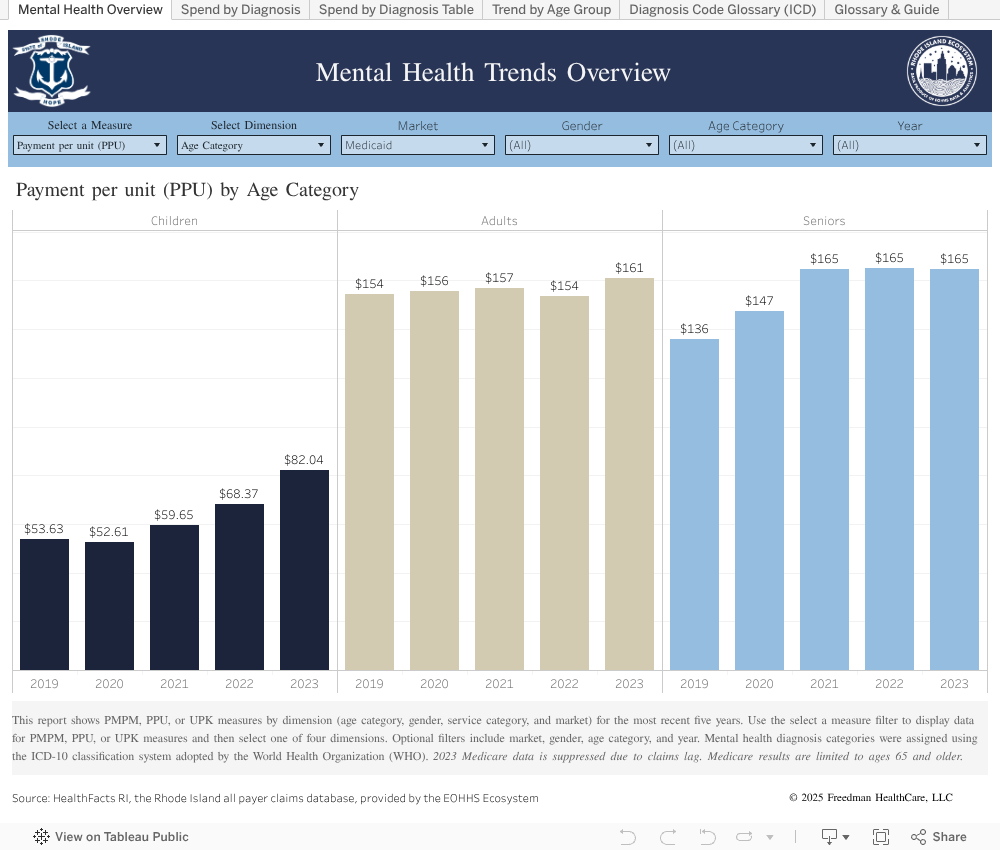
This dashboard allows users to compare spending and utilization measures by diagnosis category and identify mental health disorders that account for the largest share of total spending in Rhode Island. The measures highlight variation in utilization and spending by age group, gender, market (commercial insurance, Medicaid, Medicare), and service category or care setting. Mental health disorders were identified and grouped by diagnosis category based on an ICD-10 classification system adopted by the World Health Organization (WHO).
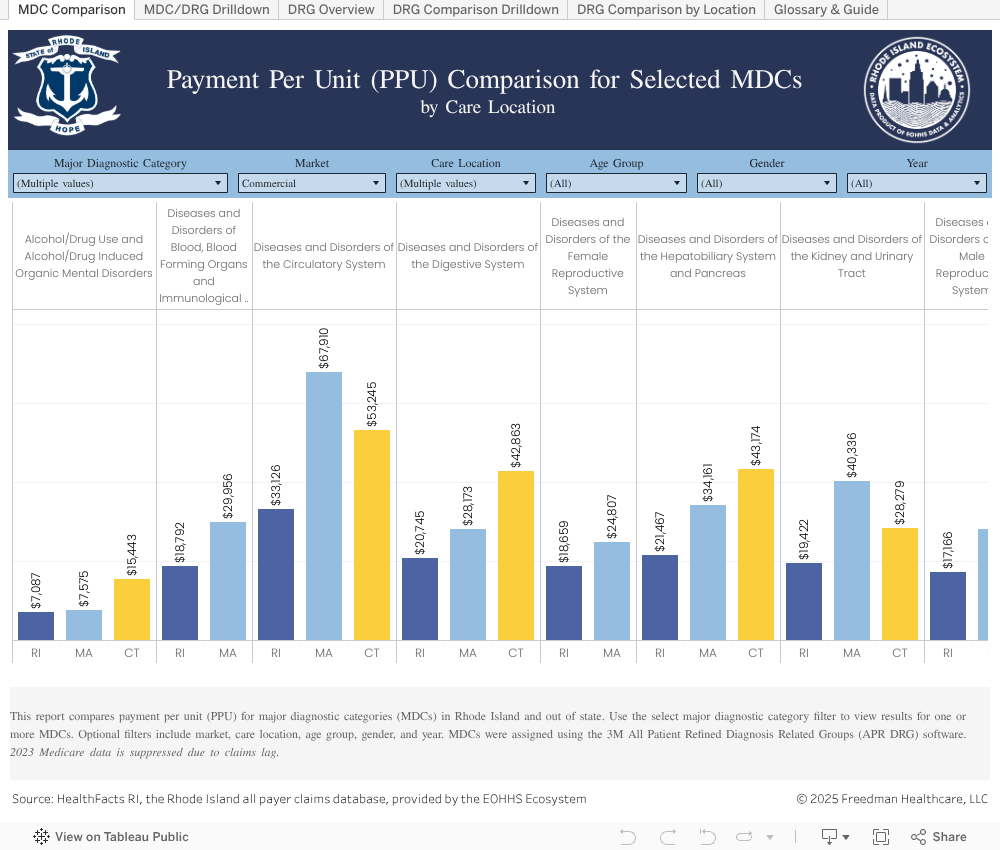
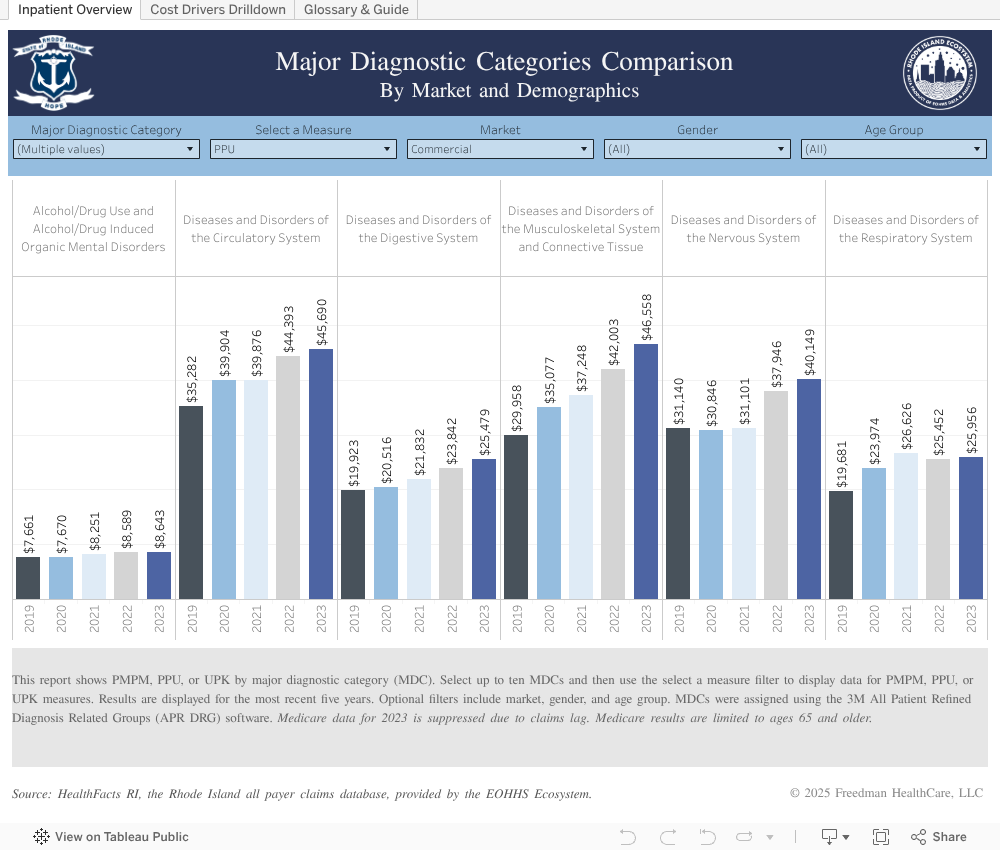
This dashboard compares in-state and out of state spending for hospital-provided services for which Rhode Island residents traveled out of state. Results are based on Major Diagnostic Categories (MDCs) and Diagnosis Related Groups (DRGs). MDCs organize illnesses into 25 mutually exclusive groups based on principal diagnoses and by medical specialty and organ system or etiology. To help facilitate meaningful comparisons, DRGs are assigned and used to categorize hospital inpatient visits based on severity of illness, risk of mortality, medical prognosis, need for intervention, and intensity of resource use in treating patients. Each DRG falls within a Major Diagnostic Category (MDC). Out-of-state care locations include Massachusetts, Connecticut, and All Other states.
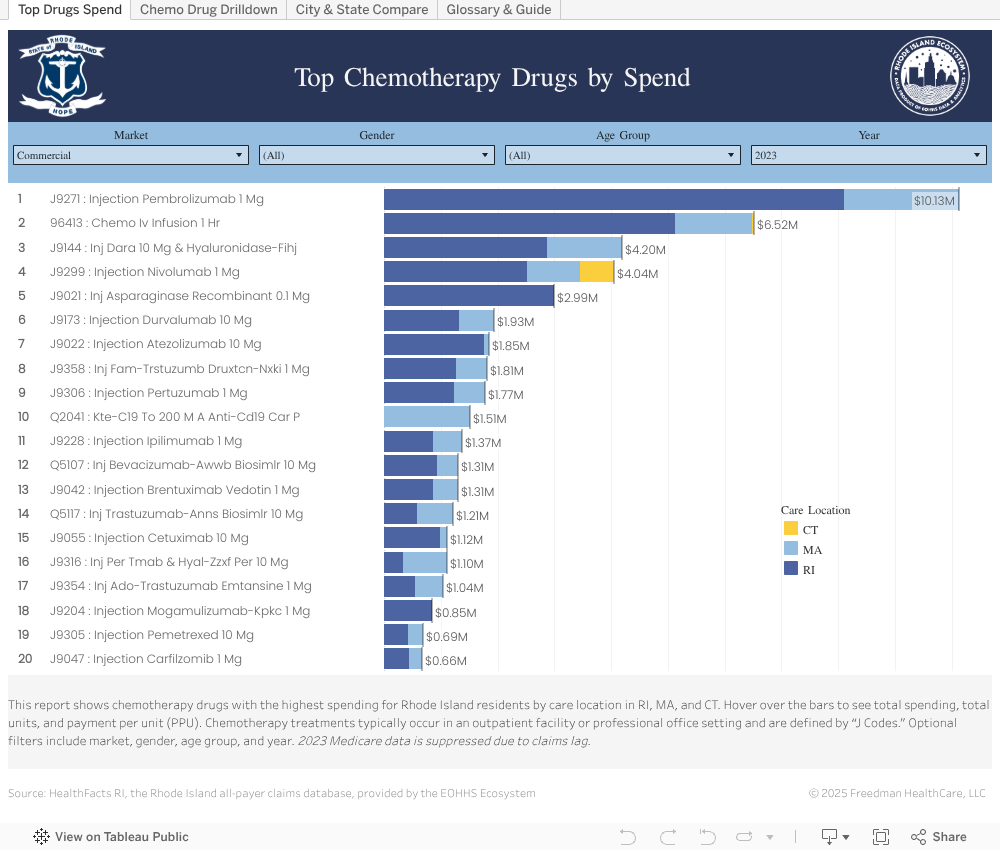
This dashboard supports analysis of utilization and spending on Chemotherapy drugs for Rhode Island residents by care location in Rhode Island, Massachusetts, and Connecticut. Users can compare total spending, units, payment per unit, and identify the Chemotherapy drugs that account for the largest share of total spend. Chemotherapy treatments typically occur in an outpatient facility or professional office setting and are defined by “J Codes.” Results are based on analysis of claims data for commercial insurance plans, Medicaid, and Medicare.
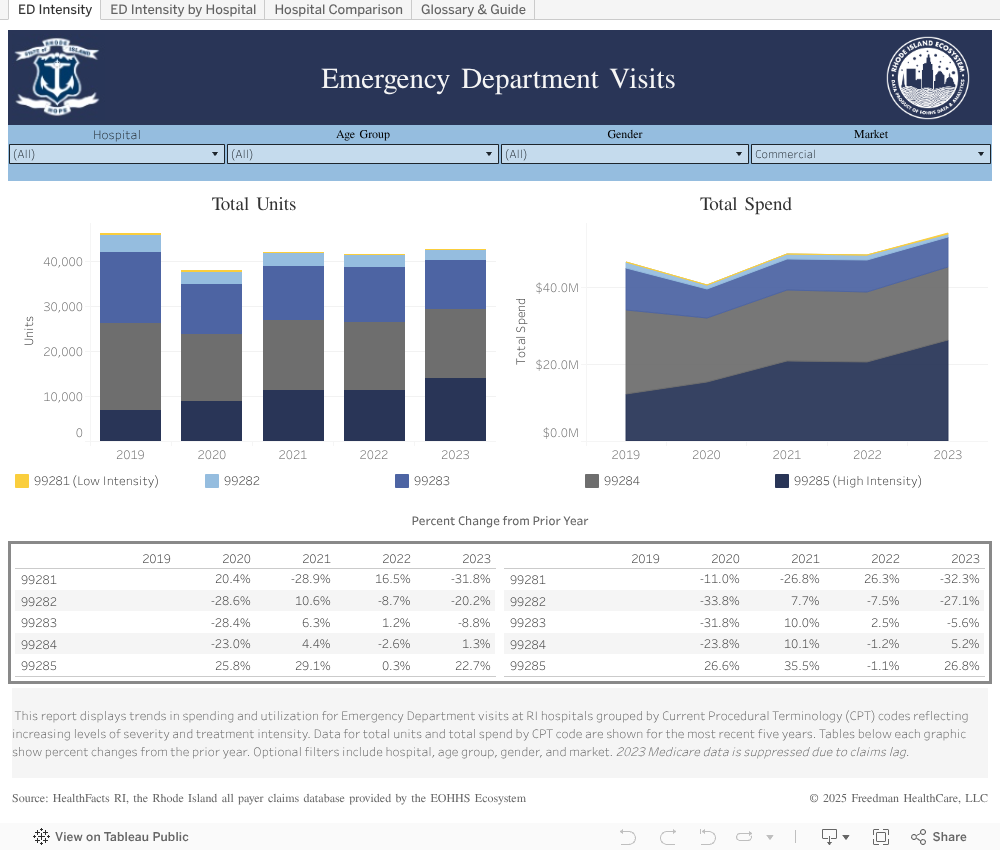
This report allows users to compare spending and utilization for Emergency Department (ED) visits by named Rhode Island hospital. ED visits are grouped using Current Procedural Terminology (CPT) codes reflecting increasing levels of presenting problem severity and treatment intensity. CPT code 99281 is assigned to ED visits for low severity presenting problems that can be addressed using relatively simple medical interventions. Codes 99282 through 99285 are used for more serious ED visits and require a medically appropriate health history and exam. These codes capture increasing intensity of needed medical intervention based on the number and complexity of presenting problems and risk of complications, morbidity, or mortality. CPT codes 99284 and 99285 are applied to the most complex ED visits requiring the highest levels of medical decision making and number and intensity of services to address.
This dashboard compares utilization and spending for hospital procedures based on Diagnosis Related Groups (DRGs). To help facilitate meaningful comparisons, DRGs are assigned and used to categorize hospital inpatient visits based on severity of illness, risk of mortality, medical prognosis, need for intervention, and intensity of resource use in treating patients. Each DRG falls within a Major Diagnostic Category (MDC). MDCs organize illnesses into 25 mutually exclusive groups based on principal diagnoses and by medical specialty and organ system or etiology.
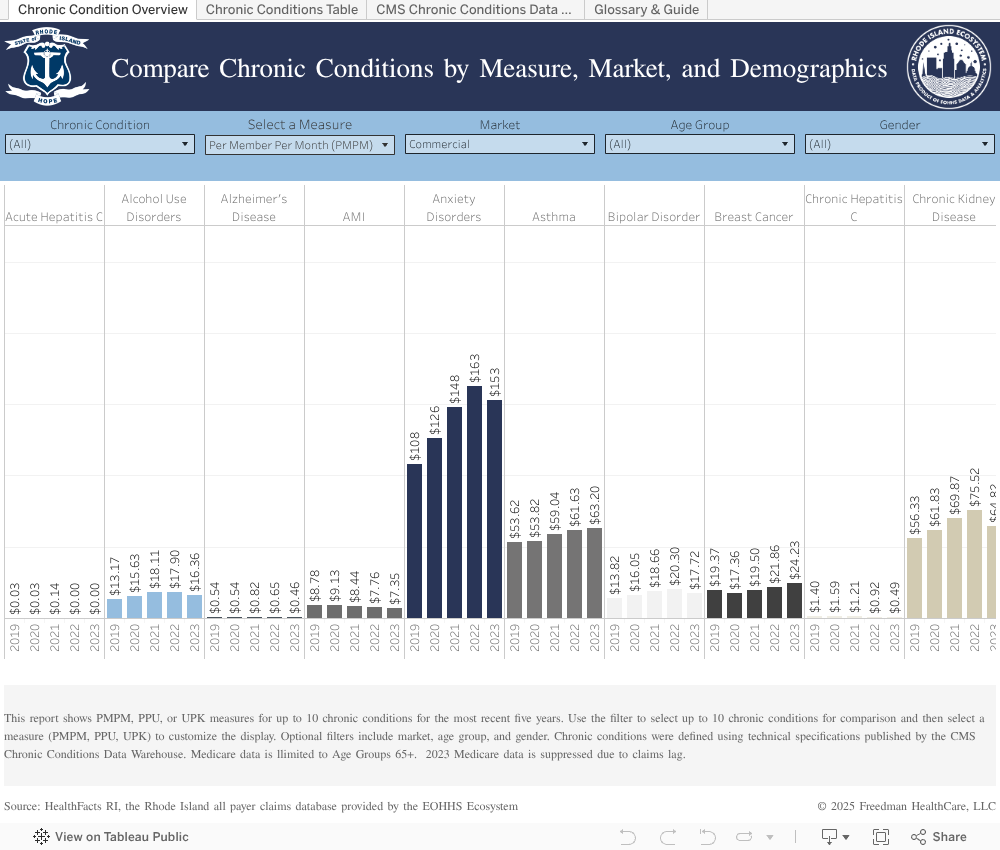
This dashboard utilizes the CMS Chronic Conditions Data Warehouse (CCW) categories to group chronic conditions, highlight variation, and help identify opportunities to reduce costs and improve the quality of care for chronically ill patients.
Data for these dashboards was obtained through an approved request to the Rhode Island All-Payer Claims Database as administered by the Rhode Island Department of Health (RIDOH). Data was obtained for 2019-2023. RIDOH is not responsible for the author's analysis, opinions and conclusions contained in this document.